
I’ve used data science to answer questions ranging from social media, economic development, and human behavior through my Stanford coursework, job experience, and curiosity during my free time.
Below are a few samples of my work:


I enjoy sharing my data analysis and research through different mediums: visualizations, long reports, short briefs, social media (ex: tweets), and journalism articles.
I have published several articles in news outlets on elections and voter behavior. See a few below:
I am a secondary author of Washington Community Alliance’s post-election reports, namely the 2024 General Election report where I contributed analysis on split-ticketing, partisanship changes over time and future projections, and more.
I tweet maps and data about politics and demographics. Followed by New York Times columnists, journalists, both WA Democratic & Republican Party chairs, political consultants, and elected officials.
I wrote several newsletters while at HaystaqDNA, including a demographic analysis on “Childless Cat Ladies” and a causal inference experiment on the impact of presidential campaign rallies on early vote turnout.
I do freelance data consulting to help campaigns, companies, and organizations to get ahead of the curve. See my services here.
Project 1 (see left): Estimated preliminary 2024 voter turnout by race before government and academic institutions published official numbers.
Project 2: Coalesced election result, early vote, demographic, and campaign field data to construct a precinct-level voter contact database to enable campaign staff to target and sort specific precincts for different voter contact methods and events
Project 3: Constructed a donor database of 10,000+ donors’ contribution history across 50+ campaigns for a consulting firm
Data Analytics Research, Journalism and Presentation

Using machine learning methods to accurately predict student wait times at Stanford Computer Science Department’s undergraduate tutoring service.
As a final group project for a machine learning CS course (Stanford’s CS 129: Applied Machine Learning), I and three classmates engineered a machine learning model to improve our (and all Stanford students’) estimated wait time messages while waiting at Stanford’s CS tutoring services.
Drawing inspiration from existing work on hospital wait time algorithms, we engineered several features in the dataset including binary flags denoting the material covered in major CS classes by week. Then we tested several algorithms from basic linear regression to XGBoost trees. Despite testing more complex models, we found that a simpler, interpretable Random Forest Tree performed best. Our model predicted wait times with an average error of 8 minutes, slashing errors in half.
Machine Learning Model Predicting Wait Time

Using data science to understand San Jose’s economy to generate insight and economic development recommendations to San Jose’s Mayor’s Office.
Alongside three classmates, I spent 5 months diving deep into business license, financial, demographic, transit, etc. data from several sources to engineer clean database(s) and analyze local urban economic dynamics in San Jose. I employed several causal inferential statistical methods to test several potential indicators or factors behind economic growth and decline, including whether proximity to transit stations increased business durability (see left).
We condensed our research and presented findings to the Mayor’s office, who used our insights to inform future economic development legislation and programs.
Capstone project for Stanford’s Data Science Major
Causal Inference Statistical Analysis for Economic Development
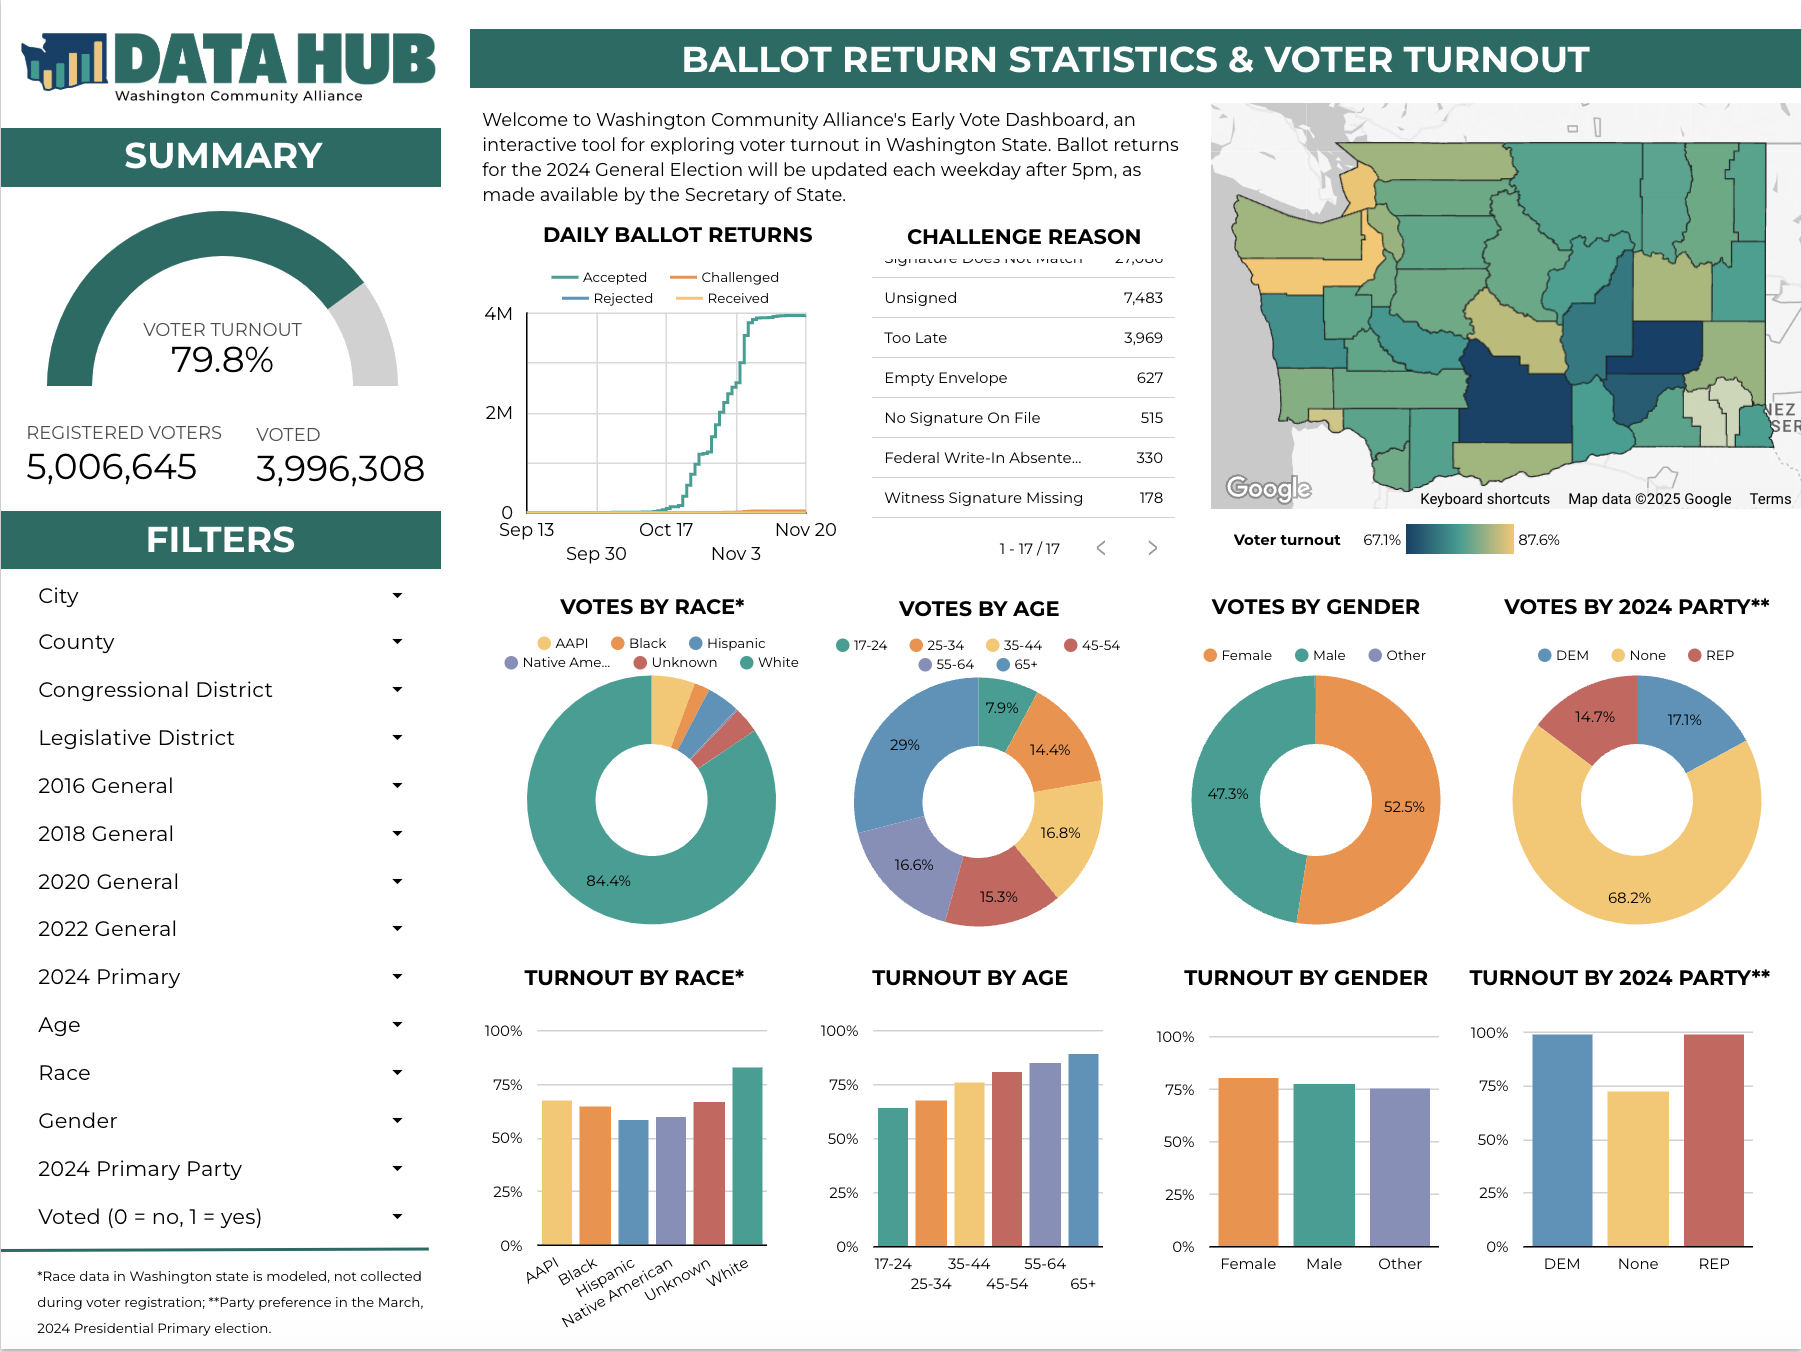
Interactive dashboards visualizing election results and early vote returns by geography and demographics.
Contributed to Washington Community Alliance (WCA) Data Hub’s dashboard(s) using Google LookerStudio and Google BigQuery (SQL). I assisted querying the data pipeline from America Votes’ cloud databases to the dashboard and structuring the data to create interactive visualizations,.
I have also contributed new features to WCA’s Election Result Dashboards, namely allowing users to view statewide results at different district shapes (ex: congressional district).
See this dashboard and WCA’s other dashboards here.
Dashboard: Visualize Early Votes & Election Results

Applying statistical analysis to human (voter) behavior along demographical lines, and using a journalism form of data presentation.
One of the most peculiar recent trends in US electoral politics is the Latino shift towards the Republican Party, namely Donald Trump. I performed a complex weighted regression to disentangle demographic and election data at the Census Block Group level to test (and confirm) a hypothesis: economic populist sentiment is driving Latinos to the right.
In the article, my co-author and I detail how the same (majority-Latino) regions that shifted to Trump since 2016 are the same regions where Democratic Senator Bernie Sanders performed best in the 2020 Democratic Primaries against Joe Biden. In fact controlling for race, education, population density, and more, Sanders support was the strongest predictor of Trump gains — even stronger than Latino population.
Statistical Modeling for Voter Behavior Analysis

Using data engineering and machine learning to predict web blog post engagement in the proceeding 24 hours.
Using this open source dataset from UCI ML Repository, my classmate and I used data science techniques to predict the number of future comments on online blog posts. This involved a lot of data engineering to construct new features (variables) to the dataset that in turn generated more insight about each blogpost and resulted in stronger model (prediction) performance. Engineered features include frequent word flags, time series statistics (ex: comments over time), and more.
Project for Stanford’s MS&E 226: Fundamentals of Data Science, graduate class in Management Science & Engineering